
INTEGRATED MANAGEMENT OF LAND BASED ACTIVITIES
IN THE SĂO FRANCISCO RIVER BASIN PROJECT
GEF/ANA/OAS/UNEP
Activity 2.1 Thematic Land Use Mapping of the Upper Săo Francisco Basin
Executive Summary of the Final Report
DETERMINATION OF LAND USE IN THE UPPER
SĂO FRANCISCO RIVER BASIN
Companhia de Desenvolvimento dos Vales do Săo Francisco e do Parnaíba
Brasília-DF
INTEGRATED MANAGEMENT OF LAND BASED ACTIVITIES
IN THE SĂO FRANCISCO RIVER BASIN PROJECT
GEF/ANA/OAS/UNEP
Activity 2.1 Thematic Land Use Mapping of the Upper Săo Francisco Basin
Executive Summary of the Final Report
DETERMINATION OF LAND USE IN THE UPPER
SĂO FRANCISCO RIVER BASIN
Coordinator
Rui Alcides de Carvalho Junqueira
Companhia de Desenvolvimento dos Vales do Săo Francisco e do Parnaíba - CODEVASF
Consultant
Karla Adriana Carneiro Rosa
Janeiro de 2002
DETERMINATION OF LAND USE IN THE UPPER
SĂO FRANCISCO RIVER BASIN
EXECUTIVE SUMMARY
INTRODUCTION
The Upper Săo Francisco, object of the present land use thematic mapping, is completely
contained in the State of Minas Gerais, corresponding to the reach going from headwaters to the
City of Pirapora. It covers a total of 164,955 km2, equivalent to 26% of the Săo Francisco River
Basin.
Figure 1- Location of mapped area and the Subdivision of the Săo Francisco Basin.
1. CHARACTERIZATION OF THE UPPER SĂO FRANCISCO
1.1. LOCATION
The mapped area is located between the 14ş and 21ş S Latitude and the 43ş30´and 47ş W
Longitude geographic coordinates, going beyond the limits of the Upper Săo Francisco and
covering part of the Middle, as shown in Figure 1. It includes the upper part of the River and the
Sub-Basins of the Velhas, Abaeté, Pará. Jequitaí, Indaiá, Urucuia, Paraopeba and part of the
Carinhanha Rivers.
i
1.2. SOCIAL AND ECONOMIC CHARACTERIZATION
The mapped area is composed by 215 Municipalities in the State of Minas Gerais, presenting a
population of 7,739,553 inhabitants, according to the 2000 Demographic Census, carried out by
IBGE. Most of this population is concentrated in urban areas. The most populated cities are Belo
Horizonte, Contagem, Betim, Montes Claros and Ribeirăo das Neves.
The expansion of productive activities in the mapped area has been strongly conditioned by its
natural resources, with forest and mine exploitation, use of its hydro-power potential and of the
rural areas for agriculture and livestock raising. The predominant crops are corn, rice, soybeans,
coffee, wheat, sugar-cane, beans, cotton, manioc, tmatoes and diverse green vegetables. The
Region presents the second largest cattle herd in the Country, with the greatest dairy production.
The cattle's origins are Índia (gir and nelore) and Europe (Holland).
Currently, great part of reforestation has been done with eucalyptus and pine, already secured for
charcoal production. This reforestation, however, has presented a low lumber productivity. The
greatest lumber producers in the mapped area are Montes Claros and Januária.
The most important mining area in the Săo Francisco River Basin, the Iron Quadrilateral, is
located in the Upper Region, close to Belo Horizonte. It is found there one of the greatest iro ore
deposits, associated to manganese, gold, diamond, calcarium, mercury, zinc, copper, lead and
dolomite, gems and precious stones deposits, among other.
1.3. PHYSIOGRAPHIC
CHARACTERIZATION
The mapped area is characterized by undulated topography and narrow river channels, with one
of the greatest water potentials in the Country. It presents a humid tropical climate with summer
rains (December through February) and dry winter (June to August). Mean annual precipitation
depths vary from 1,000 to 1,500 mm, with mean temperature around 23ş C (bellow freezing
minimum temperature in some areas).
Given the different types of relief, the soils present physical and chemical characteristics
associated with the rock occurrences. There are different soil types, including latosols (deeper
soils, located in more stable positions in the landscape, typical of tablelands), cambisols (shallow
soils, occurring predominantly in areas with uneven topography), podzols (between latosols and
cambisols, with a considerable increase in clay content, according to the depth), litholic soils
(usually presenting a fine layer of sandy material atop the rock) and hydromorphic and alluvial
soils, found on depressions associated with river canals.
1.4. NATURAL VEGETATIVE COVER
Vegetation undergoes a transition from cerrado to caatinga, with small patches of Atlantic Forest,
presenting a significantly variable structure (height a density of trees). It is important to
ii
emphasize that 96% of the Atlantic Forest and 75% of the cerrado in Minas Gerais were
destroyed during a historic chaotic settlement process.
The cerrado is the characteristic vegetation cover of semi-humid climate areas, with two well
defined seasons (dry and rainy seasons), resting predominantly on the sedimentary soils of the
Brazilian Highlands. It presents gradations from xeromorphic forests (cerradőes) to herbaceous-
bushy formations (fields). Among the predominant species, there are the lixeira (Curatella
americana), the pequi (Caryocar brasiliensis), pau-santo (Kielmeyera coriacea), pau terra
(Qualea grandiflora) and the copaíba tree (Copaifera langsddorfii).
The caatinga found in the area is predominantly composed of trees, 6 to 8 m high. Among the
main species, there are the aroeira (Schinus sp), brauna (Schinopsis sp), catingueira (Caesalpinia
sp), umbuzeiro (Spondias tuberosa), several cactaceous, such as the mandacaru (Cereus
jamacaru), xiquexique (Pilocereus gounelli) and cabeça de frade (Melocatctus sp).
Dry trees are the closest to caatinga vegetation found in the mapped area, being known as the dry
forest. It is a transitional vegetation between the Forest and the caatinga. The cerrado encircles
the dry trees, with shorter trunks and usually thicker barks, supporting firm branches more or less
warped. Its structure varies according to the degree of dehydration they are subject to, loosing the
leaves by mid-year. Other species found are the angico (Piptadenia sp.), catole (Syagrus
Oleracea) and timbauba (Entereolobum contortisiliquum).
2. MATERIAL
2.1. TOPOGRAPHIC
CHARTS
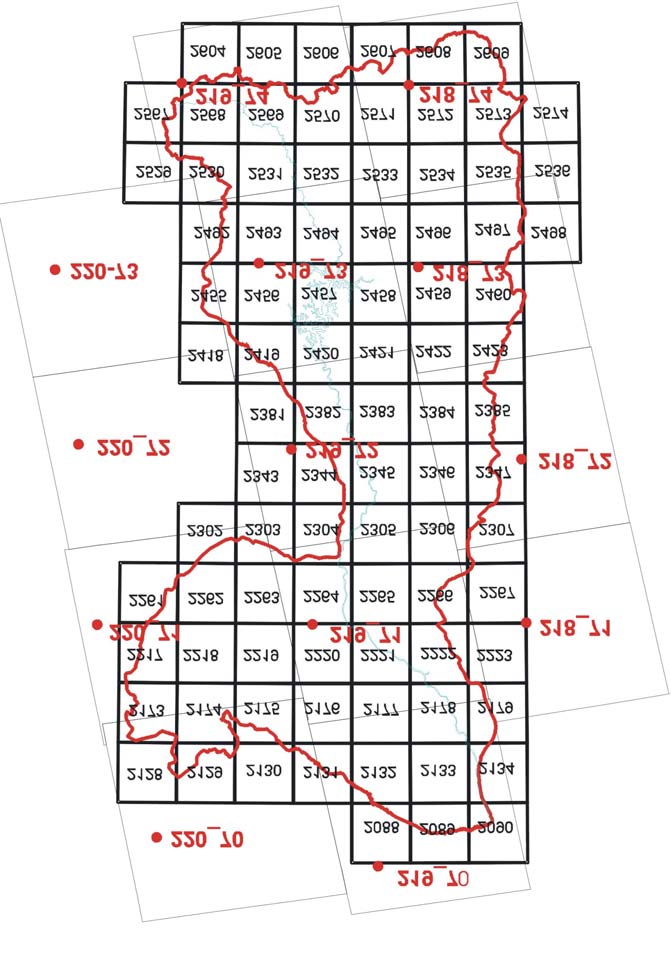
The work used 88 Topographic charts of IBGE (Brazilian Institute of Geography and Statistics)
and of the Army's Directory of Geographical Survey, in a 1:100,000 scale. The digital base on
1:100,000 scale, provided by CODEVASF, with vectorial data (hydrography, road network and
referenced points) presented digitalization errors, such as merging and continuity of lines.
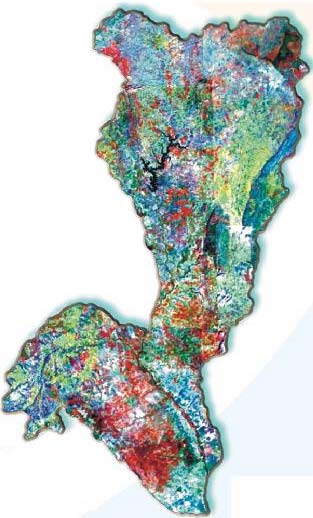
2.2. LANDSAT 5 SATELLITE IMAGES
This mapping used 13 images from the Landsat 5 Satellite, from 1995 and 1996. Bands 3, 4 and
5, in the R/4 G/5 B/3 color combination, were chosen for the job. In this composition, the areas
with more vegetation are displayed in reddish tones, those with less vegetation in greenish and
those with water or high humidity in blue. Figure 2 presents the articulation between the used
IBGE charts and Landsat 5 images.
iii
Órbita-Ponto Data
218_71 21/12/95
218_72 07/07/95
218_73 13/10/96
218_74 15/08/95
219_70 08/02/95
219_71 21/12/95
219_72 31/08/95
219_73 02/10/95
219_74 15/08/95
220_70 21/07/95
220_71 21/07/95
220_72 21/07/95
220_73 29/01/96
Figure 3 Articulation of IBGE´s topographic charts and Landsat 5 images
3. METHODOLOGY
3.1 DEFINITION OF CARTOGRAPHIC PARAMETERS
The adopted projection system was the Universal Transverse Mercator projection, the Córrego
Alegre Horizontal Datum, the vertical datum from the marigraph at Imbituba (SC) and the 1967
New International ellipsoid reference, Zone 23, South. The minimum dimension for the area to be
interpreted was set in 0.1 Km2.
iv
3.2. LEGENDA
The adopted legenda represents the classes used in this work, for the diverse natural and
anthropized existing areas, as described ahead:
Natural vegetation covers
Anthropized covers
Other
Cerrado/Cerradăo
Pasture
Water
Cerrado Field
Agriculture
Clear field
Irrigated area
Rupestrian field
Degraded area
Riparian wood
Urbanized area
Dry forest
Reforestation
Atlantic Forest
Floodplains
Vereda
Rock emergences
NATURAL VEGETATION COVERTURES
· Cerrado e Cerradăo: Structurally formed by three strata (first, superior and arboreous). It
might grow 8 to 12 meters high, in average (some specimens may emerge up to 20 meters).
· Cerrado Field: Intermediate vegetation form between the cerrado and the field. Its dossel
reaches, in average, 10% coverture, with well distributed trees with up to three meters high. It is
formed by small warped trees. It includes species such as the pau-santo (Eielmeyera corineae), a
lixeira (Curatella americana), o murici (Brysonima spp.), a gomeira (Vochysia thyrsoidea).
· Clear Field: Predominantly herbaceous, with sparse bushes and lack of trees, with emphasis to
grasses measuring from 3 mm to one meter.
· Rupestrian Field: Constituted by herbaceous strata, more or less continuous, and by
permanently green bushes. Among other families, there are the Velloziaceae, the Xyridaceae and
the Rubiaceae.
· Riparian woods: Following the water courses, usually in narrow strips, not exceeding 100
meters wide, in each margin. It is extremely important to the preservation of the springs. The
most characteristic species are the pindaíba (Xylopia muricata), ipe (Tecoma heptaphila) and
buriti (Mauritia flexuosa).
· Dry Forest: Transitional vegetation between the Forest and the caatinga, with smaller trunks,
thicker barks and relatively warped branches. About 30% of the trees loose their leaves in the dry
season. The found species are the angico (Piptadenia sp.), catolé (Syagrus Oleracea), timbauba
(Entereolobum contortisiliquum) and camondongo (Pythecolobium olycephalum).
v
· Atlantic Forest: With a rich biodiversity, it maintains springs and resources. It is the most
endangered biome in Brazil. Lumber exploitation, agriculture and livestock raising expansion and
real state speculation are among the most critical causes of destruction of the Atlantic Forest. It is
characterized by the predominance of big trees, especially peroba (Aspidosperma sp), cedar
(Cedrela fissilis), jatoba (Hymenaea sp) e an aroeira (Asttronium sp).
· Floodplains: Subject to periodic flooding, it occurs along rivers. Usually it contains trees with
tabular roots, such as the sumauma (Ceiba pentandra).
· Vereda: Its simple structure is composed by a thin layer of herbaceous species, most of them
grasslike species, ciperacea e pteridophyte, with occurrences of buriti trees (Mauritia flexuosa),
its characteristic vegetation.
· Rock emergence: Presents exposed rock material, which may or may not be associated to the
presence of vegetation.
ANTHROPIZED COVERTURES
· Pasture: This class includes brachiaria, buffel grass, colonial grass, guinea grass and jaragua
grass, among other.
· Agriculture: Areas planted with anual or perennial crops.
· Irrigated Area: Area occupied with CODEVASF's public irrigation perimeters, or by large
private properties, where well oriented agriculture is practiced.
· Degraded Area: Areas with occurrences of gullies, with erosion processes in advanced stages.
· Urban Areas: Municipal Seats, villages and pueblos detected by the satellite images.
· Reforestation: Eucaliptos and pinus reforsted areas, mainly for charcoal production.
· Rock emergences: Exposed rock material, associated with the presence of vegetation.
OTHER
· Water: It accounts for rivers, lakes, lagoons and reservoirs.
3.3. EDITING VECTORIAL DATA
The digital cartographic base, in 1:100,000 scale, supplied by CODEVASF, including the road
network and the referenced points, needed adjustments. Digitalization errors, such as merging
and line continuity, were detected and corrected, thus improving the aesthetics of the vectorial
data.
vi
3.4. IMAGE INTERPRETATION AND CLASSIFICATION
Significant corrections and/or image retouching were not necessary, as those had good quality. In
order to have a unique coordinate system for all images, the 13 of them were transferred into a
UNIX based workstation, maintaining the georeferencing used for the 1:100,000 sheets. The
ERDAS Imagine 8.3 software was used for that purpose. A hundred distributed control points
were used, resulting in na RMS transformation error of 0.7 m.
The image interpretation process took advantage of the combination of the original bands in color
compositions. In that process, the six available Landsat 5 bands could be combined three by
three. In view of the objectives of the work, bands 3, 4 and 5 were utilized, with the band 4
associated to the R (red) channel, band 5 to the G (green) and band 3 to the B (blue), which is
technically known as the RGB/453 composition.
Even though the multispectral classification is efficient for identification of water, it was
necessary to make use of digitalization and screen interpretation, as in the conflict areas, where
pixels associated to distinct classes were hard to distinguish, given the similarity of the patterns.
3.5. EDITING SATELLITE IMAGES
After the supervised classification of the images, they were vectorized using the ArcInfo 7.3
software, viewing the creation of a database and the combination of the 88 classified sheets into
one file. In this process, the spline, generalize and calculate commands were used, creating
vectorial polygons with soft curves and eliminating polygons smaller than 0.1 km2. An editing
process was implemented, to close open polygons and disconnected vectors, aligning and making
them compatible.
3.6. FIELD STAGES
Two Field Visits were made, to verify in loco the reality of the mapped classes in the Upper Săo
Francisco. Hard copies of the maps were printed and taken to the field and pictures were taken of
the existing classes.
Equipped with a vehicle and a GPS (Global Positioning System), the two field visits departed
from and ended in Belo Horizonte. The main doubts were related to the Dry Forest, Floodplains,
Vereda, Degraded Areas and Pasture classes.
The first Field Visit was to the Northern part of Minas Gerais, to the Municipal Seats of Caetés,
Sete Lagoas, Curvelo, Corinto, Bocaiúva, Montes Claros, Săo Francisco, Manga, Montalvânia,
Unaí, Paracatu, Joăo Pinheiro, Pirapora and Tręs Marias. The second went to the Southern part of
the mapped area, to the Cities of Contagem, Brumadinho, Ouro Preto, Itabirito, Congonhas,
Conselheiro Lafaete, Oliveira, Itapecerica, Arcos, Lagoa da Prata, Bom Despacho, Pará de
Minas, Itaúna, Pitangui, Abaeté, Săo Gotardo and Patos de Minas.
vii
4. MAPPING
PRODUCTS
· Elaboration of the Final Report, describing the methodology and presenting the mapping
products;
· Preparing and plotting the Land Use and Vegetative Covertures in the upper Săo Francisco
Basin, in the 1:600,000;
· Creation of the "jpg" files , for plotting the maps;
· Conversion of the vectorial data used in the work, to the shp and apr formats (ArcView 3.2),
and recording in CD-ROM.
5. CONCLUSIONS
This work consisted of recovering thematic land use mapping information, collected by
CODEVASF, in 88 sheets in 1:100,000 scale, to create a digital information base on vegetation
cover and land use. The available information included Landsat 5 images, from 1995 and 1996,
backed by terrestrial verification. No flights were made over the area. The original work was
limited to the land use classification in the 88 sheets, one by one, not aiming at homogenization
of the classes.
The integrated mapping of the Upper Săo Francisco sheets was objectively done. Nevertheless,
this areas exceeds the traditional boundaries of Upper Săo Francisco, as defined in the available
literature. Analyses of the spatial distribution of the diverse classes of land use and vegetative
covers were carried out for the integrated area, leaving out the analyses of individual sheets.
Actually, the work focused on the homogenization of the mapped classes, so that they could be
presented in the same map, for assessment of the results.
Figure 3 displays a map of the area under study. The predominant classes are the Clear Field
(31%), Cerrado Field (17%), Pasture (15%) and Cerrado/Cerradăo (15%). The other classes had
percentages inferior to 5%. The map presents the degraded areas, especially in the Metropolitan
Region of Belo Horizonte, where there is intensive exploitation of minerals. Spread over 320.7
km˛, it corresponds to 0.2% of the total area.
Chart 1 presents the areas and respective percentage distribution of the different classes used in
the mapping. Figure 4 shows the distribution (%) of the classes, with respect to the total area.
The summation of all classes associated with Natural Vegetation Covertures corresponds to
75.5% of the mapped area. This value is not compatible with the economic activities being
carried out there, according to information from State agencies and IBGE. One of the reasons for
this distortion might be related to the Clear Field Class, which is also used as natural pasture
(livestock raising is the predominant activity in the area).
viii
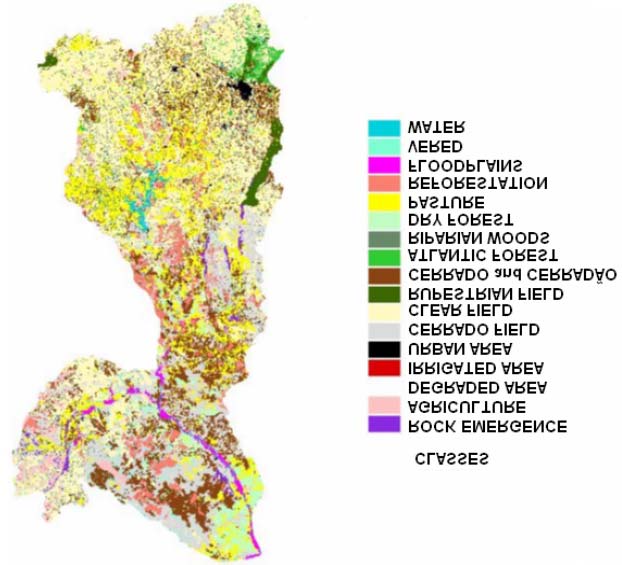
Figure 3- Land Use Mapping of the Upper Săo Francisco.
ix
Chart 1 Areas and percentage distribution of the different classes in the Upper Săo
Francisco.
Class Area (km2) % of total area
Cerrado/Cerradăo
24,586.9 15.0
Clear Field
51,158.9 31.0
Cerrado Field
28,175.5 17.1
Rupestrian Field
2,447.7 1.5
Atlantic Forest
1,942.2 1.2
Riparian Woods
6,274.8 3.8
Dry Forest
5,003.0 3.0
Vereda
1,861.7 1.1
Floodplains
1,671.0 1.0
Rock emergence
1,271.7 0.8
Agriculture
4,420.2 2.7
Pasture
24,529.0 15.0
Reforestation
7,965.3 4.8
Irrigated Area
274.8 0.2
Urbanized Areas
1,122.0 0.7
Water
1,930.3 1.2
Degraded Area
320.7 0.2
Total 164.955,7
Km2 100%
x
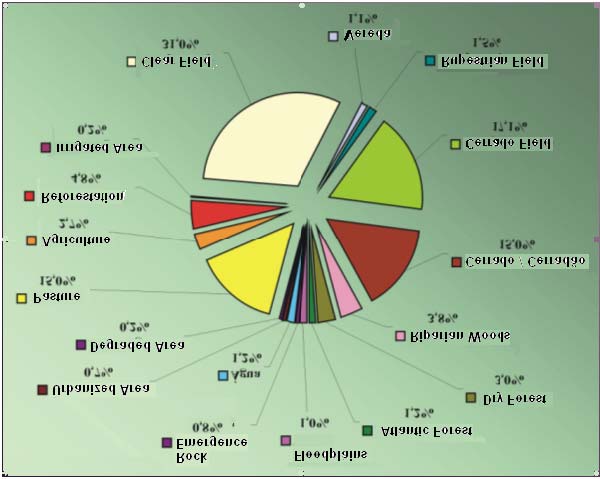
Figura 4- Areas and percentages of the Classes in the Upper Săo Francisco.
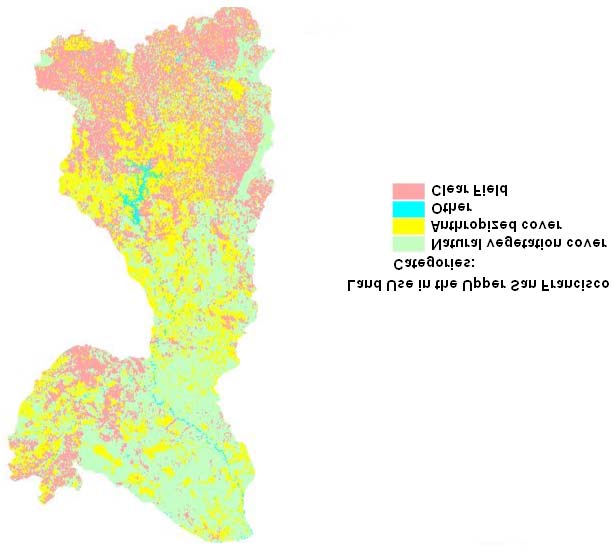
5.1. GROUPED
CATEGORIES
For easier analysis of the results, the classes in the thematic mapping of the Upper Săo Francisco
were grouped according to four categories: Natural Vegetation Covertures, Clear Fields,
Anthropized Covers and Other.
· NATURAL VEGETATION COVERTURES
Nine classes were considered in the natural vegetation covers: Cerrado/Cerradăo, Cerrado Fields,
Rupestrian Fields, Atlantic Forest, Riparian Woods, Dry Forest, Rock Emergence, Vereda and
Floodplains, accounting for 44.4% of the total area (73,234.5 km2)..
· CLEAR FIELDS
In the Clear Field category, no other classes were included and it was not considered as part of
the Natural Vegetation Covers, as the area is already being used for economic activities. It might
be considered as resultant of anthropic alteration of the cerrado's physiognomy, or being used as
natural grazing land. The category covers 31% of the total mapped area, corresponding to
51,158.9 km2.
xi
· ANTHROPIZED COVERTURES
The anthropized areas are represented by six classes which suffered direct anthropic intervention:
Agriculture, Pasture, Reforestation, Irrigated Areas, Urbanized Areas and degraded Areas. They
correspond to 23.4% of the mapped area, or 38,632.0 Km2.
· OTHER
Only the WaterCategory was considered here (rivers, lakes, lagoons and reservoirs), representing
1.2% of the mapped area. Figure 5 and Chart 2 present the four categories of grouped classes.
Figure 5- Land Use Mapping in the Upper Săo Francisco, by Category.
xii
Chart 2 Distribution of areas and percentages of the four categories of grouped classes.
Categories area
(km2)
% of total area
Natural Vegetation Covertures
73,234. 44.4%
Clear Field
51,158. 31.0%
Anthropized Covers
38,632.0 23.4%
Other
1,930.3 1.2%
Total 164,55.7
Km2 100%
6. RECOMMENDATIONS
The current stage of the mapping of the physiographic regions of the Săo Francisco River Basin
was shown in Figure 10 of the Executive Summary of the Mapping of the Lower Săo Francisco,
presented in earlier pages. The figure makes evident that most of the area is still to be mapped or
already requires updating.
It is recommended to extend the remote sensing orbital coverture to the Middle Săo Francisco, in
addition to carrying out the updating of the Upper sector, mapped by CODEVASF (1996) and
recovered and edited by The GEF GEF Săo Francisco Project.
6.1. THEMATIC MAPPING EXECUTION AND UPDATING SCHEDULE
It was verified that anthropization levels are high in the Upper, Middle-Lower and Lower Săo
Francisco. Even though degradation is not intense, the high level of human impacts determines
the need for a regular and permanent supervision of the area, given that the interface between the
anthropized and the degraded areas is very tenuous.
Based on these facts and on the anthropization indices estimated for the mapped areas, varying
from 50% to 75%, a new time schedule was prepared for updating the maps. The Schedule is also
shown in Figure 11 of the Executive Summary of the Lower Săo Francisco Mapping.
The program considers 3-year intervals for the new mappings. It is emphatically recommended
that the basic methodology be maintained, so that the new products can be comparatively
analyzed. In this way, the material might be used for multi-temporal evaluations, extremely
useful and conclusive with respect to the evolution of degradation and of the land use patterns.
xiii
6.2. MAPPING THE MIDDLE SĂO FRANCISCO
The Project will be carried out by a team of seven consultants, experts in digital cartography,
remote sensing, photo-interpretation, geoprocessing and in GIS, to be contracted exclusively for
that purpose. The work will have a 12-month duration, at estimated costs equivalent to
US$346,040, including a counterpart of US$250,000 from CODEVAF, as detailed in Chart 3.
Chart 3 Estimated costs for the Middle Săo Francisco Mapping Project (values in US$).
DISCRIMINATION partial
Total
10 Activity's personnel
210,000
1200 Consulting services
210,000
1201 (7 consultants, at 2,500/month x 12 months)
210,000
1600 Trips
11,040
1601 12 (twelve) airline tickets
6,000
1602 80 (eighty) Daily allowances
5,040
1999 TOTAL OF COMPONENT
221,040
221,040
40 Material
15,000
4100 Working Material
4101 Office supplies
15,000
4999 TOTAL OF COMPONENT
15,000
15,000
50 Diverse
110,000
Maintenance
20,000
Satellite images
30,000
Helicopter rental
60,000
5999 TOTAL OF COMPONENT
110,000
110,000
TOTAL 346,040
346,040
CODEVASF's COUNTERPART
250,000
250,000
TOTAL FOR PROJECT
596,040
596,040
xiv
6.3. UPDATING THE UPPER SĂO FRANCISCO
The Project for updating the Upper Săo Francisco will be carried out by a team of six consultants,
with expertises similar to those indicated for the previous proposal. The duration of the work will
be 10 months, with an estimated budget of US$272,410. In this Project, CODEVASF's
counterpoart will be of US$200,000, as detailed in Chart 4.
Chart 4 Estimated costs for Updating the Upper Săo Francisco (values in US$).
DISCRIMINAÇĂO Parcial
Total
10 Activity's personnel
150,000
1200 Consulting services
150,000
1201 (6 consultants, at 2,500/month x 10 months)
150,000
1600 Trips
9,410
1601 10 (tem) airline tickets
5,000
1602 70 (seventy) Daily allowances
4,410
1999 TOTAL OF COMPONENT
159,410
159,410
40 Material
13,000
4100 Working Material
4101 Office supplies
13,000
4999 TOTAL OF COMPONENT
13,000
13,000
50 Diverse
100,000
Maintenance
15,000
Satellite images
25,000
Helicopter rental
60,000
5999 TOTAL OF COMPONENT
100,000
100,000
TOTAL 272,410
272,410
CODEVASF's COUNTERPART
200,000
200,000
TOTAL FOR PROJECT
472,410
472,410
These recommendations for the Middle and Upper Săo Francisco should be considered in the
preparation of the Strategic Actions Plan, to be developed with subsidies presented by the diverse
Activities of the GEF Săo Francisco Project.
xv